
MERRA-2 Quasi-Biennial Oscillation
The QBO consists of alternating downward propagating easterly and westerly winds in the equatorial stratosphere with a period of ~28 months. Upward propagating waves, selectively filtered by the QBO winds, provide the needed momentum source for the QBO acceleration. Data assimilation, combined with parameterized wave drag, creates a realistic QBO in the GMAO MERRA-2 reanalysis system. Here each QBO cycle is divided into 6 relative times and averaged over the nearly 15 MERRA-2 QBO cycles to highlight the meridional circulations induced by the QBO. They propagate downward with the QBO winds and tend to expand with latitude as they descend. While recent reanalyses have done a good job in representing QBO zonal winds, they have traditionally done a poor job in representing the associated QBO-induced meridional circulation. As seen here, MERRA-2 has a realistic representation of the meridional circulation anomalies associated with the QBO. These QBO meridional circulations directly modulate the movement of air as it enters the troposphere from the stratosphere.
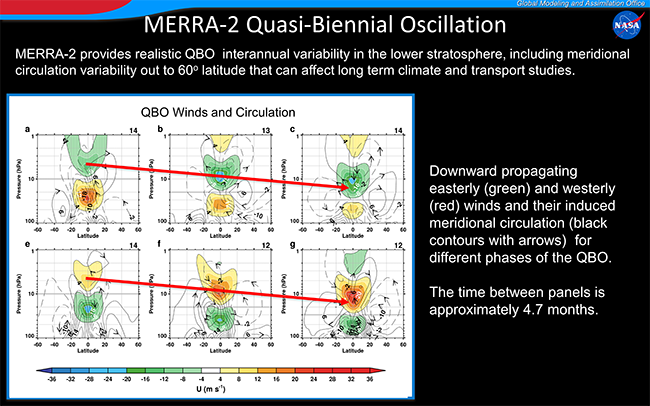
Figure Caption: QBO Winds and Circulation: A transport circulation (residual mean circulation) was created based on MERRA-2 monthly averaged, pressure level, winds, heat fluxes, and momentum fluxes. This residual circulation accounts for both the zonally averaged meridional wind and the net transport effects of wave motions. The monthly residual circulation (over 425 MERRA-2 months) were then processed at each latitude and pressure by first removing the monthly average from each month (eliminating the time mean and annual cycle) and then Fourier filtering the time series, retaining periods from ~14-212 months. This filtering includes both the QBO period (~28 months) and its higher harmonic (~14 months). The higher harmonic includes some of the known variation between the easterly and westerly descending wind shear phases of the QBO. The same filtering was used on the zonally averaged zonal winds. Composite fields were then created based on the filtered wind being near zero with easterlies above at 10, 20, and 30 hPa (a, b, c) and westerlies above also at 10, 20, and 30 hPa (e, f, g).
These levels are denoted by the gray horizontal line. Only months close to the selected transitions were averaged with the number of months averaged noted in the upper right of each panel. These numbers vary because some of the the transitions did not have a month near them. (Calculations for a lower level at 40 hPa (not shown) revealed the 40 hPa easterly to be similar to the 10 hPa westerly and the 40 hPa westerly to be similar to the 10 hPa easterly as the QBO cycle began to repeat.) The average time between panels is about 4.7 months.
The winds are contoured with filled contours (4 m/s interval, zero not shown) according to the color scale. These filtered and averaged wind amplitudes are smaller than the actual winds which typical range from about -30 to 15 m/s at 30 hPa. The figure shows the repeated descending pattern of the QBO winds. The filtered residual circulation is plotted as a mass stream function with contours labeled as in units 107 Kg/s with a 4x10⁷ Kg/s contour interval. (For comparison, the tropospheric mass stream function for the Hadley cell peaks near 15×1010 Kg/s, so the QBO circulations are about 1000× weaker in terms of mass. However, the mass is also 100× less in the lower stratosphere than in the troposphere and these stratospheric circulations are filtered and averaged.) Negative (counter-clockwise) flow contours are dashed. The arrows give the sense of the circulation. Comparison of the upper and lower panels shows the reversal of the circulation during the corresponding out-of-phase QBO configuration. The circulation descends with the winds becoming broader in latitude as it descends.