
Tracking Hurricanes with GEOS-5
November 2012
While by no means the most active year on record, the 2012 Atlantic hurricane season was far from quiet. In the "average" year, 11 named storms, including six hurricanes, will form in the Atlantic basin. By November, however, the 2012 hurricane season had already seen 19 named storms, 10 of which were hurricanes. 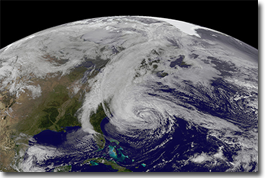
GOES-13 satellite image of Hurricane Sandy on October 28, 2012. Image courtesy of the Earth Observatory. Seven of these systems made landfall in North America, including Hurricane Isaac and "Super-Storm" Sandy (see satellite image at right), which devastated the northeastern U.S. in late October.
The structure and life cycle of these severe storms can be viewed through the detailed meteorological analyses and forecasts that the GMAO conducts on a routine basis with our GEOS-5 system. The GMAO routinely produces five-day forecasts twice daily, at 0000 and 1200 UTC, using the GEOS-5 global atmospheric general circulation model. The GEOS-5 atmospheric data assimilation system is used to generate near real time analyses of the atmosphere over the globe every six hours ( See GEOS-5 Product Details ). These analyses provide the initial conditions for the GEOS-5 forecasts. The forecasts themselves are produced at a quarter-degree horizontal resolution with 72 vertical levels, and take into account the effects that aerosols (e.g. dust, black carbon/soot, and sea salt) and trace gases (e.g. ozone, carbon monoxide, and carbon dioxide) have on atmospheric circulations. More in-depth information on GEOS-5 can be found here. //
In order to evaluate the performance of the GEOS-5 system, the GMAO monitors the skill of GEOS-5 forecasts. Following the abnormally active 2012 Atlantic hurricane season, one focus has been on the skill of the GEOS-5 forecasts of tropical storms in the Atlantic. Here we look at two of the most destructive storms of the season: Hurricanes Isaac and Sandy.
Hurricane Isaac was identified as a tropical storm on August 21, and made landfall in the U.S. as a Category 1 hurricane on August 28. Throughout the entirety of Hurricane Isaac's existence, from its first appearance as a tropical depression to its landfall as a Category 1 hurricane, GEOS-5 was able to forecast Isaac's track rather well (see Figure 1). Though the accuracy of a storm's forecast track will vary depending on lead time, forecast tracks for Isaac were consistent and in general agreement with the observed track. For instance, between August 24 and August 25, Isaac's track abruptly turned south before heading northwest again. As random as this movement might have seemed, the general trend of the motion was forecast by GEOS-5. Isaac's landfall proved slightly more difficult to predict. Prior to landfall, GEOS-5 and other NWP models forecast the site of Isaac's landfall at different locations between southwestern Louisiana and the panhandle of Florida. However, starting August 26, all GEOS-5 forecasts predicted landfall in or near southeastern Louisiana, not far from where it actually occurred.
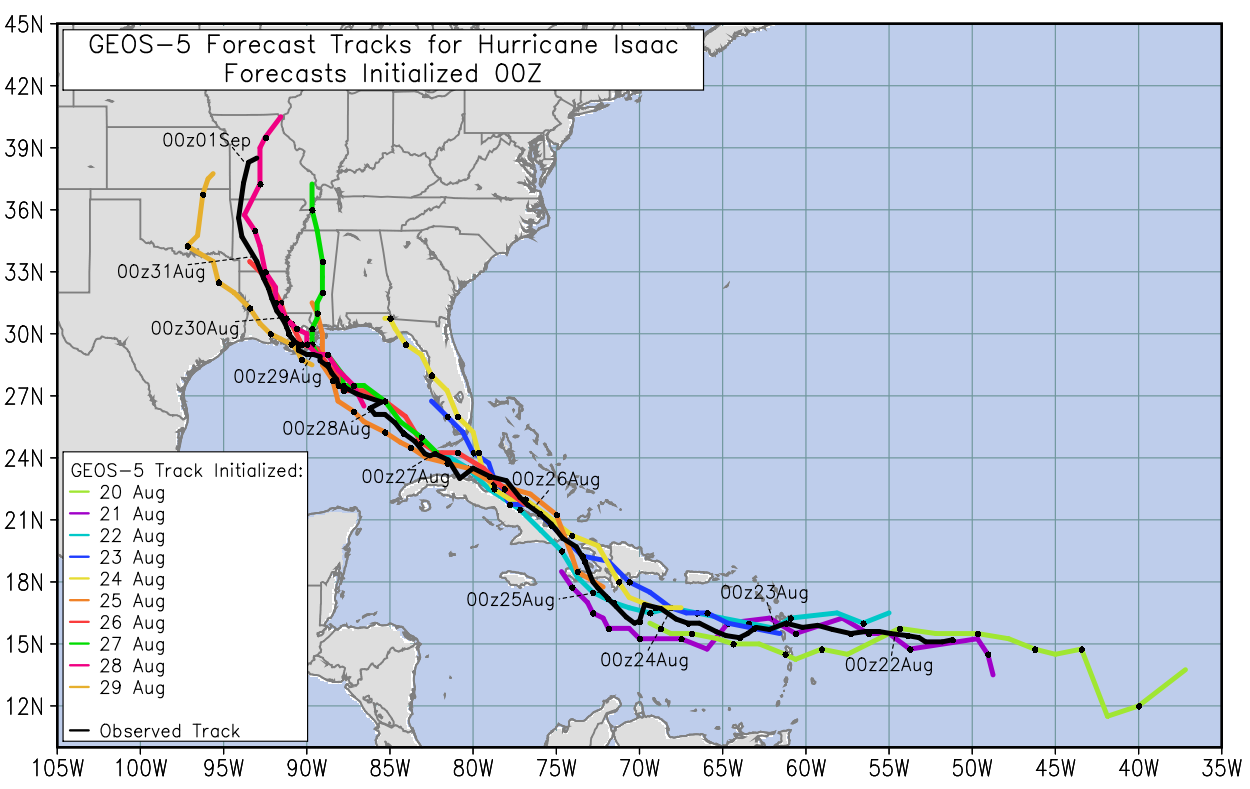
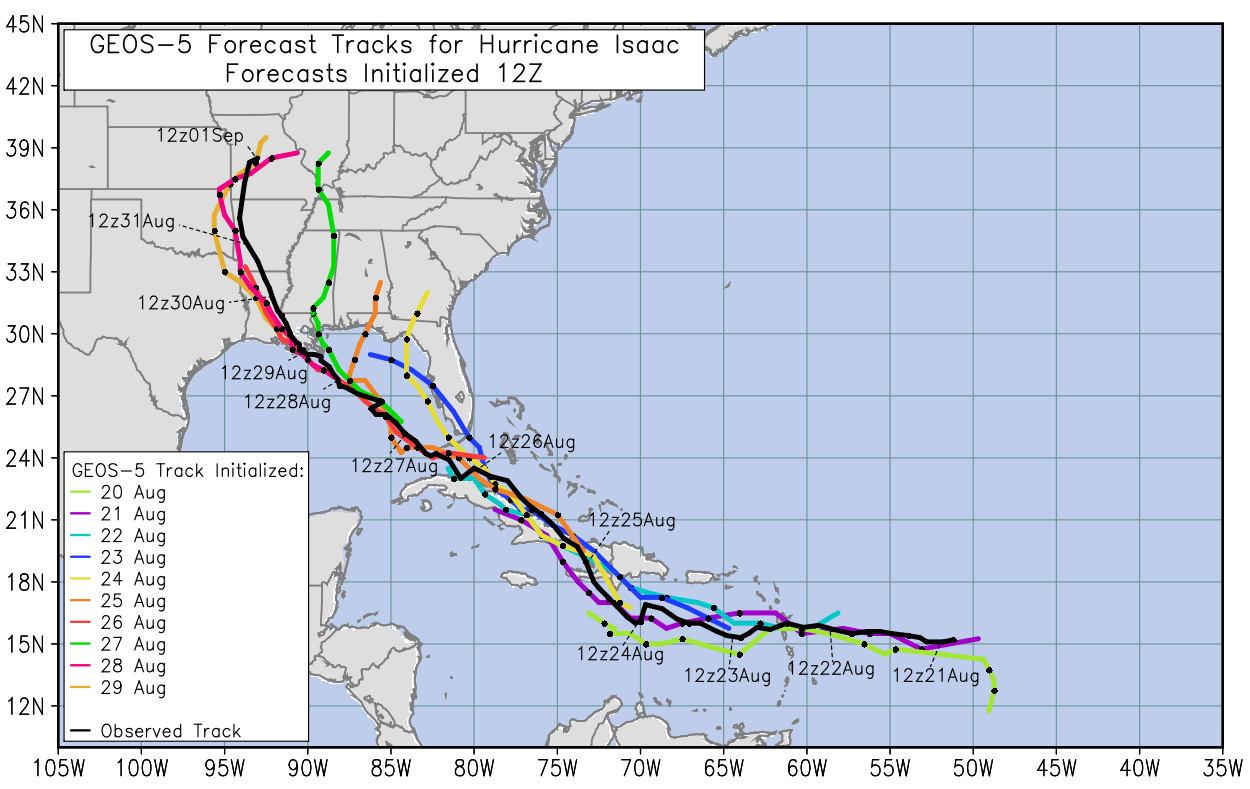
click for larger image
GEOS-5 forecasts for Isaac's lowest pressure (hereafter referred to as its intensity) were generally within 5 hPa of the observed central pressure for much of Isaac's life cycle (see Figure 2). Though the model had a somewhat difficult time forecasting Isaac's intensification, several GEOS-5 forecasts did anticipate aspects of the basic pattern of the change in Isaac's central pressure. For example, early GEOS-5 forecasts projected Isaac's minimum pressure to decrease and rebound around August 25, which was verified by observations. After Isaac made landfall and began to weaken, GEOS-5 intensity forecasts tended to converge towards the observed minimum pressure and closely follow its increase.
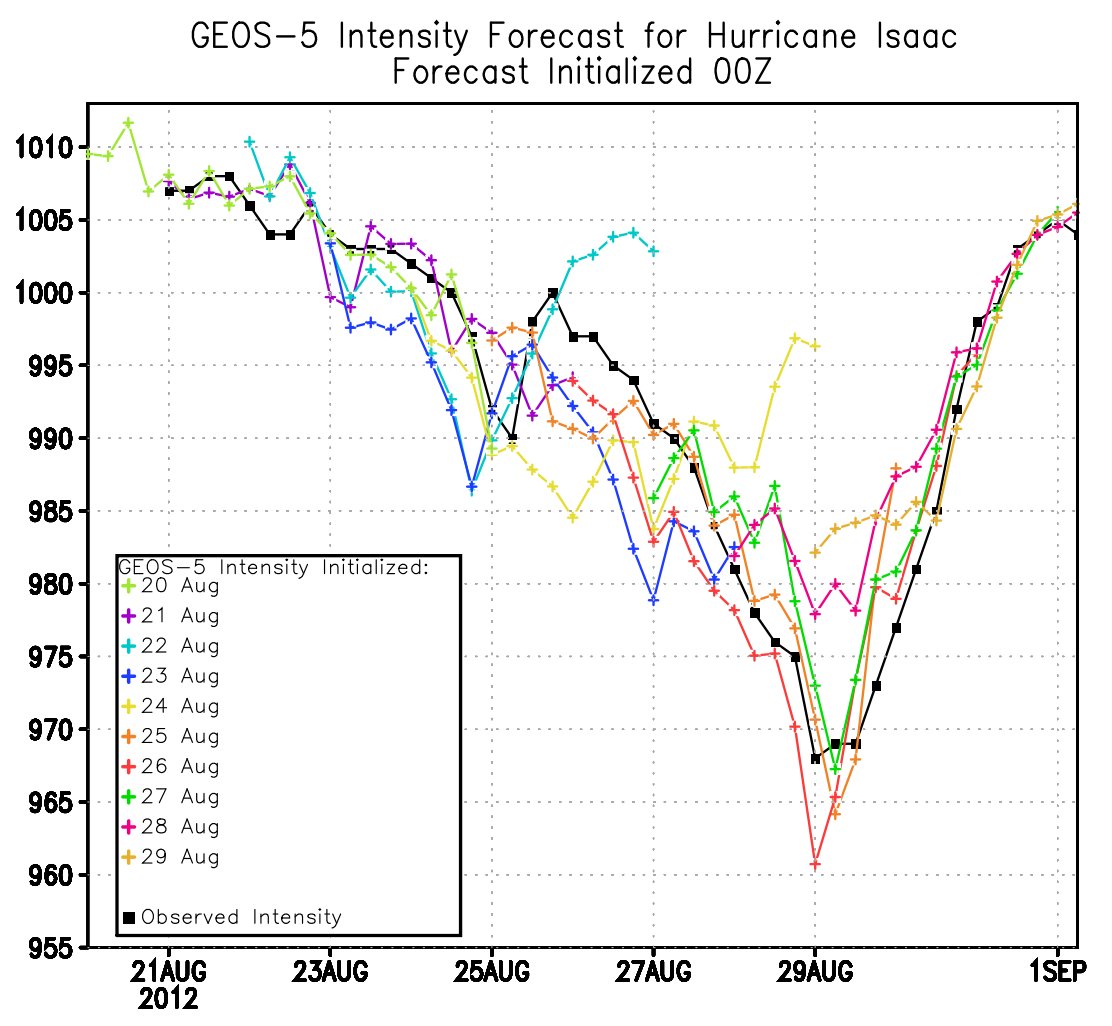
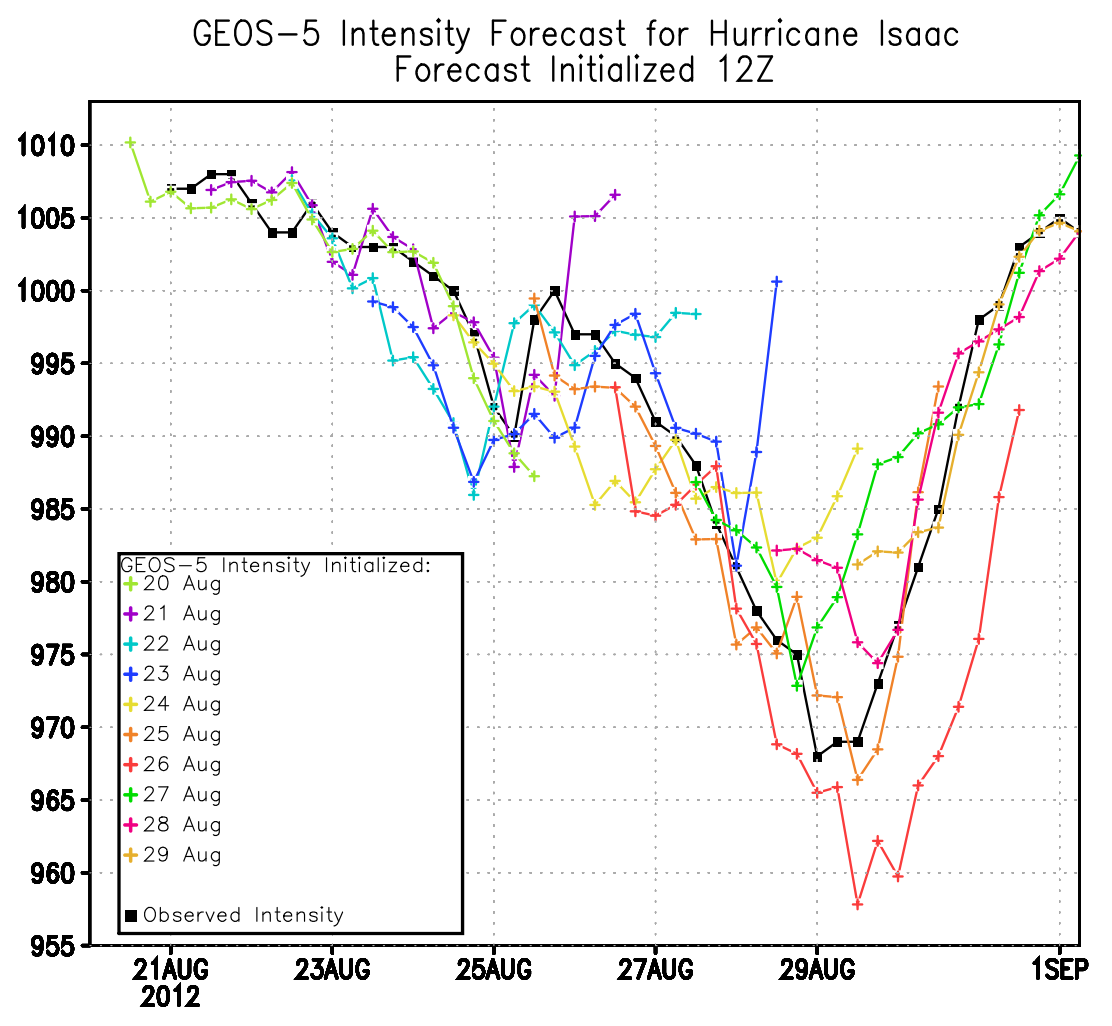
click for larger image
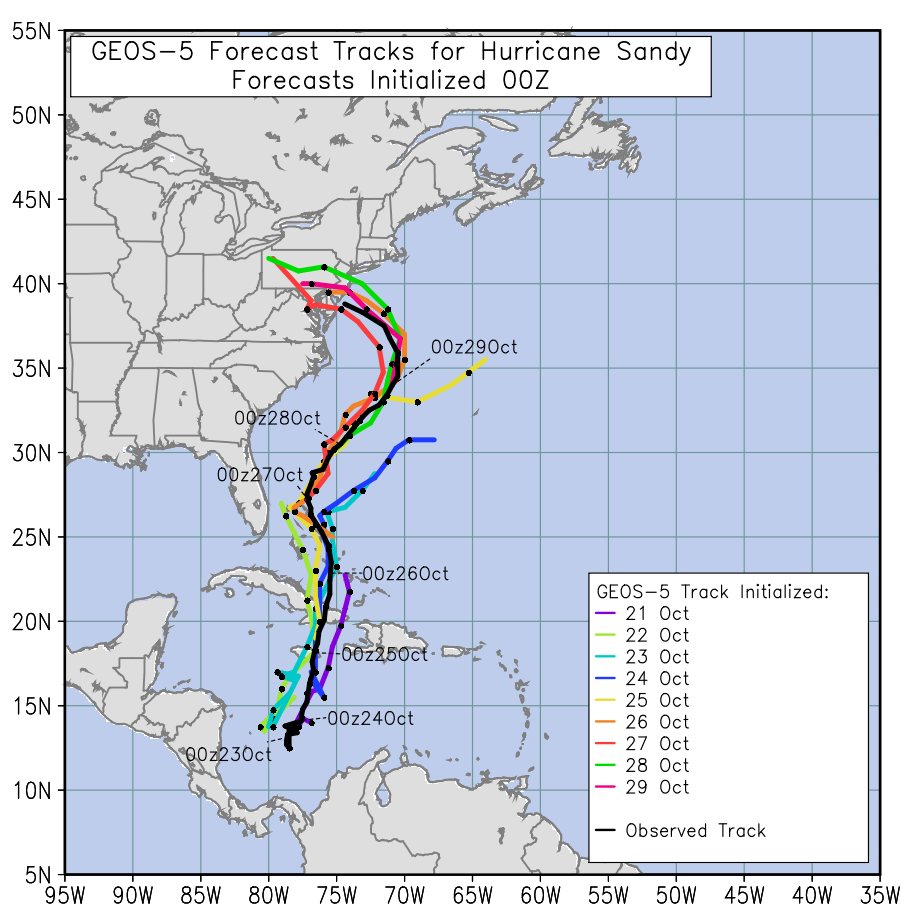
Hurricane Sandy was identified as a tropical storm on October 22, and made landfall in the U.S. as a storm with Category 1 winds on October 30. From the day Sandy was first classified as a hurricane, GEOS-5 forecasts had predicted that a trough in the jet stream would travel across the United States and ultimately push Sandy away from land as it neared the coasts of the Carolinas. However, the GEOS-5 forecast initialized on October 25 1200 UTC predicted that the trough in question would develop a negative (northwest-to-southeast) tilt by the beginning of the next week. This would serve to alter Hurricane Sandy's expected track in a way that few wanted to believe was possible. Instead of pushing Sandy off into the Atlantic, the trough was forecast to pull it in towards the northeast coast, where GEOS-5 predicted it would make landfall as an intense storm with an exceptionally large radius of tropical storm force winds.
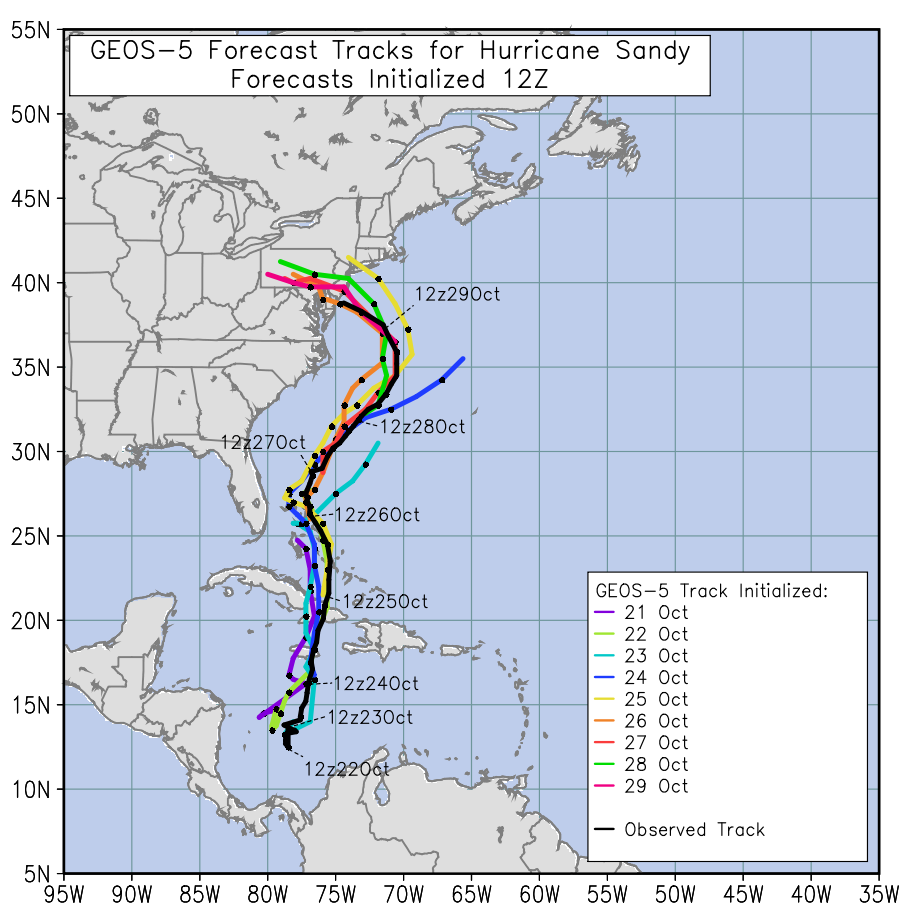
As shown in Figure 3, GEOS-5 forecast Sandy's track very well throughout the life of the system. Apparent in the plots is how the model forecast the storm to veer off towards the open ocean in early model runs, but by October 26, GEOS-5 had the center of Sandy paralleling the Atlantic coast and turning inland towards northern New Jersey and southern New York. All subsequent GEOS-5 forecasts projected Sandy to parallel the coasts of North Carolina and Virginia and make landfall somewhere in or just south of New Jersey, as actually occurred.
click for larger image
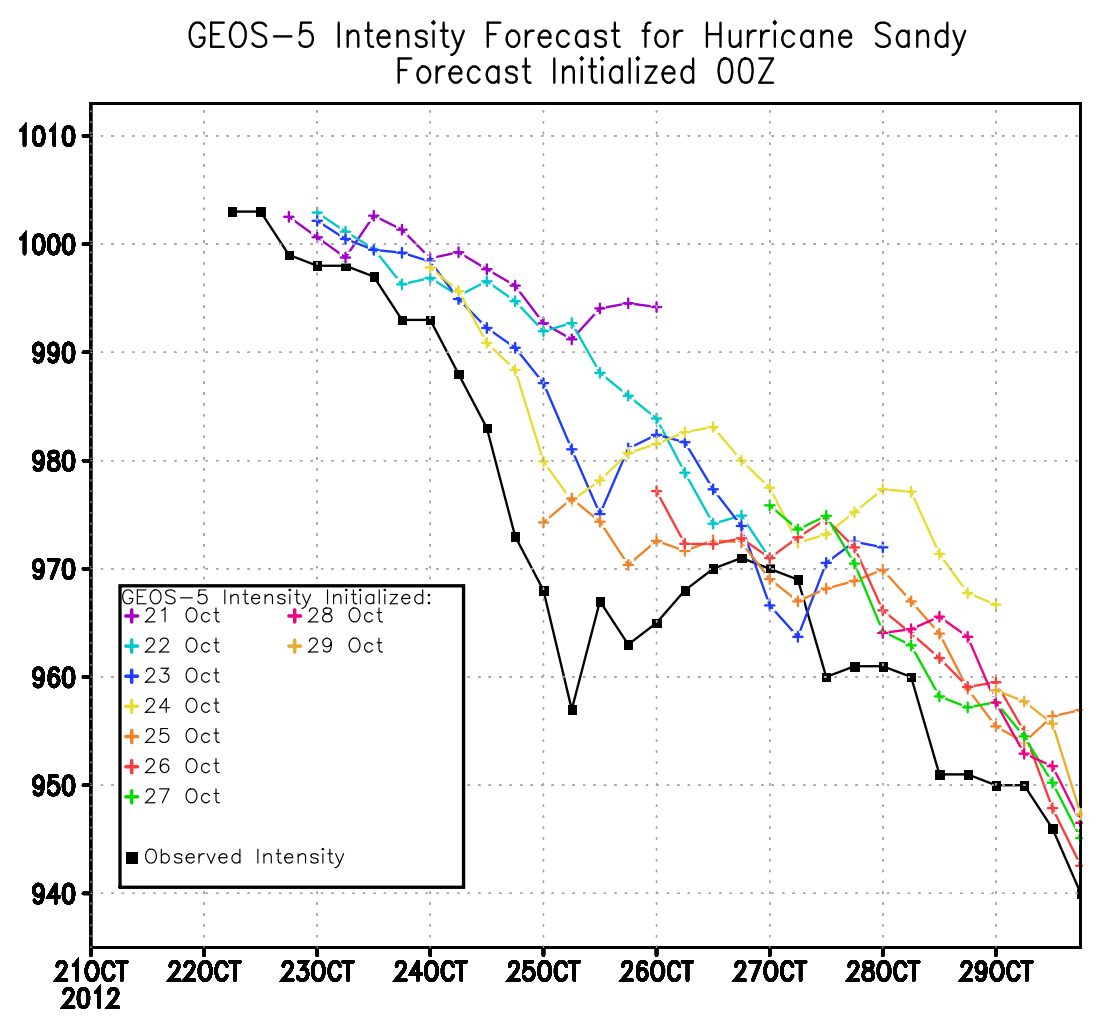
GEOS-5 predicted Sandy's intensity to within a few hectopascals over much of the life of the storm. GEOS-5 also forecast the general pressure trends of the storm relatively well (see Figure 4), and anticipated some of the finer details of the storm's evolution. For instance, the GEOS-5 forecasts initialized on October 23 predicted that the storm's intensification would halt on October 25 and that the storm would weaken before again intensifying. This pattern was observed in nature as well. The forecast initialized at 1200 UTC on October 26, which most correctly anticipated the location for Sandy's landfall, also appeared to perform the best at forecasting Sandy's intensity.
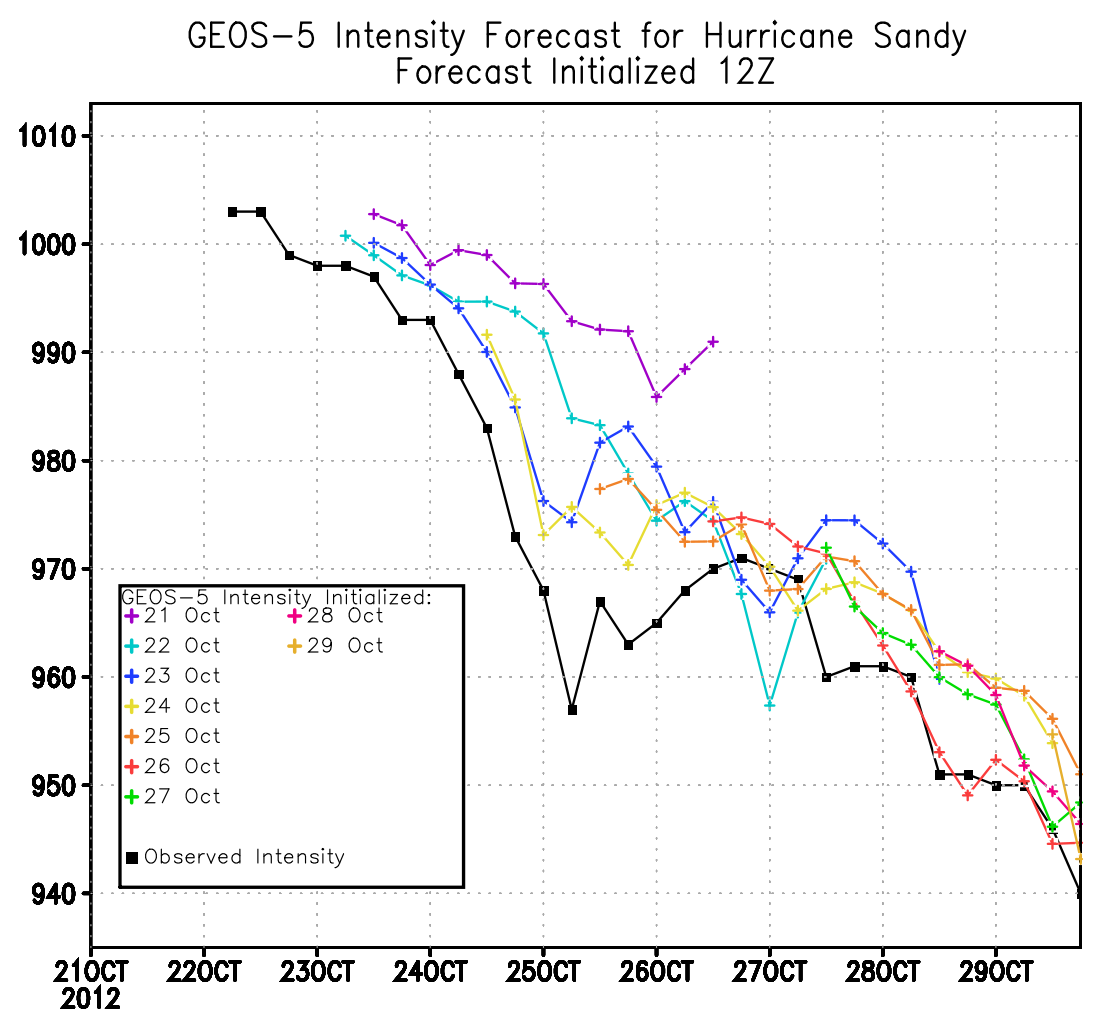
click figure for larger image
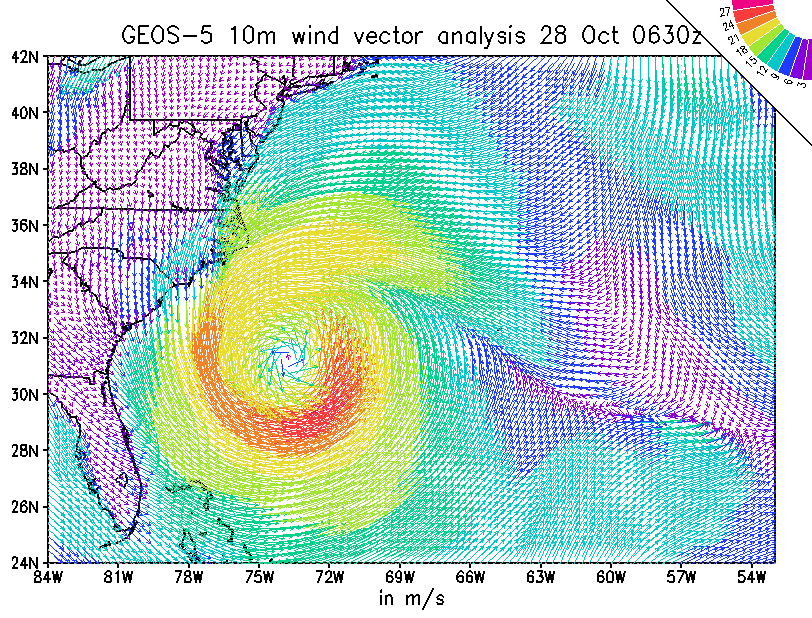
In addition to forecasting Sandy's track and intensity rather well, especially in the one-to-three-day range, GEOS-5 also correctly forecast some key aspects of its structure. For example, GEOS-5 forecast that the winds around Sandy's center would retain a compact structure, as was observed. Also forecast was a wind maximum, initially located to the south of the storm's center, that migrated to the storm's eastern quadrant just prior to landfall (see Figure 5). This migration of strong winds and its timing served, in part, to spare those locations to the south of the Sandy's center from experiencing excessive wind damage, but added force to the storm surge experienced in the Tri-State area, since strong winds east of the storm center acted to funnel more water into New York's Lower and Upper Bays. Farther up the coast, as can also be seen in Figure 5, GEOS-5 predicted another region of stronger winds that was associated with a warm front present with the storm. This feature, though not nearly as intense as Sandy itself, was apparent in the observations (see Figure 6).
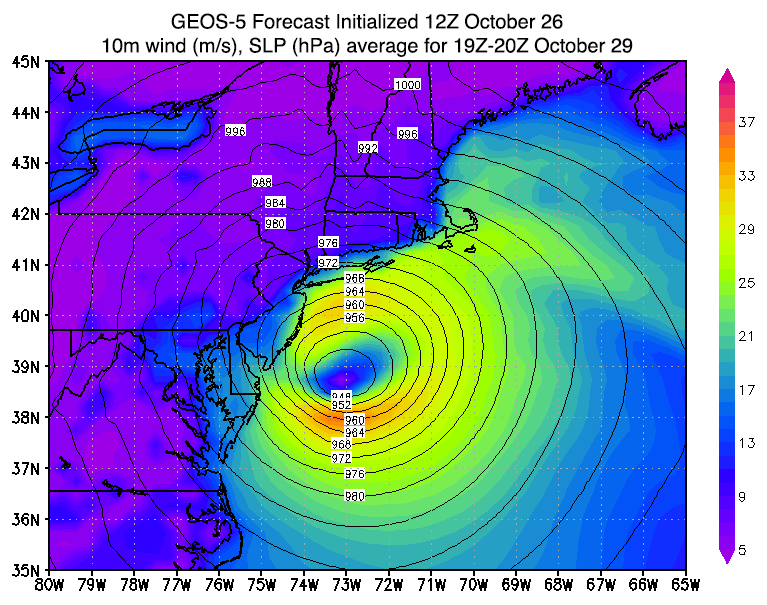
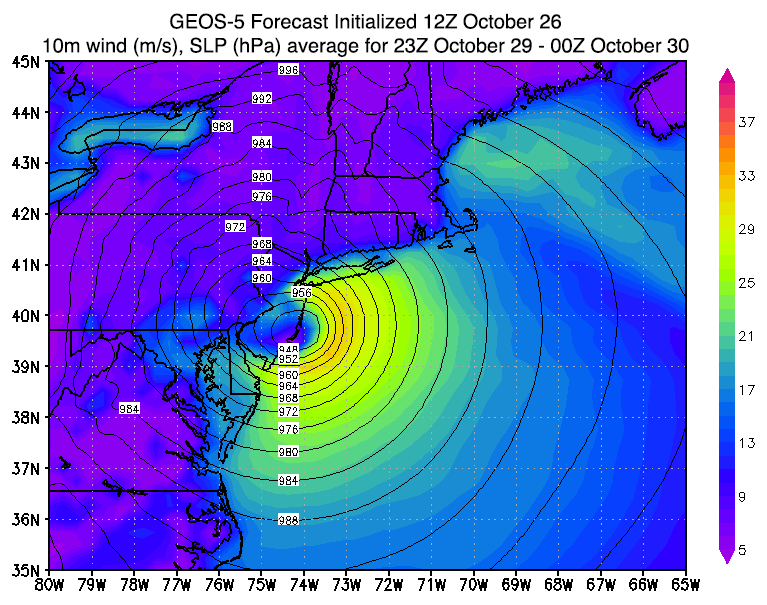
click figure for larger image
click figure for larger image
Though GEOS-5 was generally able to forecast aspects of Hurricane Sandy very well, further investigation illuminated ways in which the tropical cyclone forecasts may be improved. For instance, Washington D.C., eastern Maryland, northeastern Virginia were projected to experience winds much stronger than were actually observed. A post-storm examination of the vertical profiles of wind and temperature in these areas revealed a layer of isothermal (constant temperature) air below the 850 hPa level that prevented higher velocity winds farther up in the atmosphere from mixing down towards the surface. Considering that this layer was quite thin, it was missed in forecasts. The addition of more vertical layers to the model may have improved the forecasts of winds south and west of Sandy's center. Increasing the model's horizontal resolution would also improve forecasts. A comparison of GEOS-5 results when the model was run at the typical quarter-degree resolution with the results from a 7-km resolution run (see Figure 7) shows that the higher resolution run performed better at forecasting Sandy's track and its intensity.
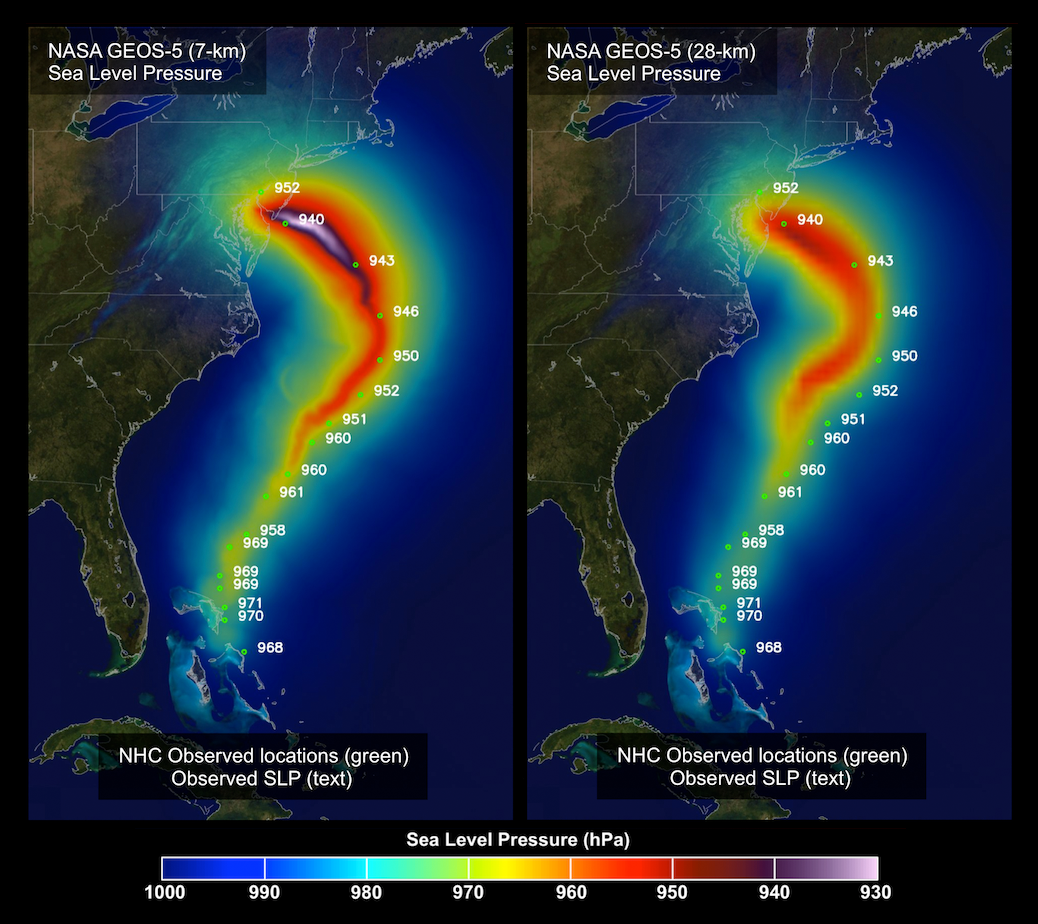
click figure for larger image
GMAO GEOS-5 Hurricane Animations (click on an image to play)
These types of investigations and verification exercises concerning the forecasting of events like tropical cyclones are important to assessing the success of numerical weather prediction models and to identifying the ways in which they can be improved. The GMAO continues to undergo such analyses of GEOS-5 forecasts. Data from research projects like NASA's Hurricane and Severe Storm Sentinel mission ( HS3 ), for which GMAO has contributed forecast support, will aid the GMAO in bettermodeling the physical processes that produce severe weather. Additionally, ongoing efforts to improve the assimilation of the latest satellite observations will help the GMAO and other NWP centers to improve weather analyses and forecasts.
The GEOS-5 HS3 forecast suite: http://gmao.gsfc.nasa.gov/projects/HS3/
Contributors: Ron Gelaro, Marangelly Fuentes, Gary Partyka, Bill Putman