Sampling in Time
|
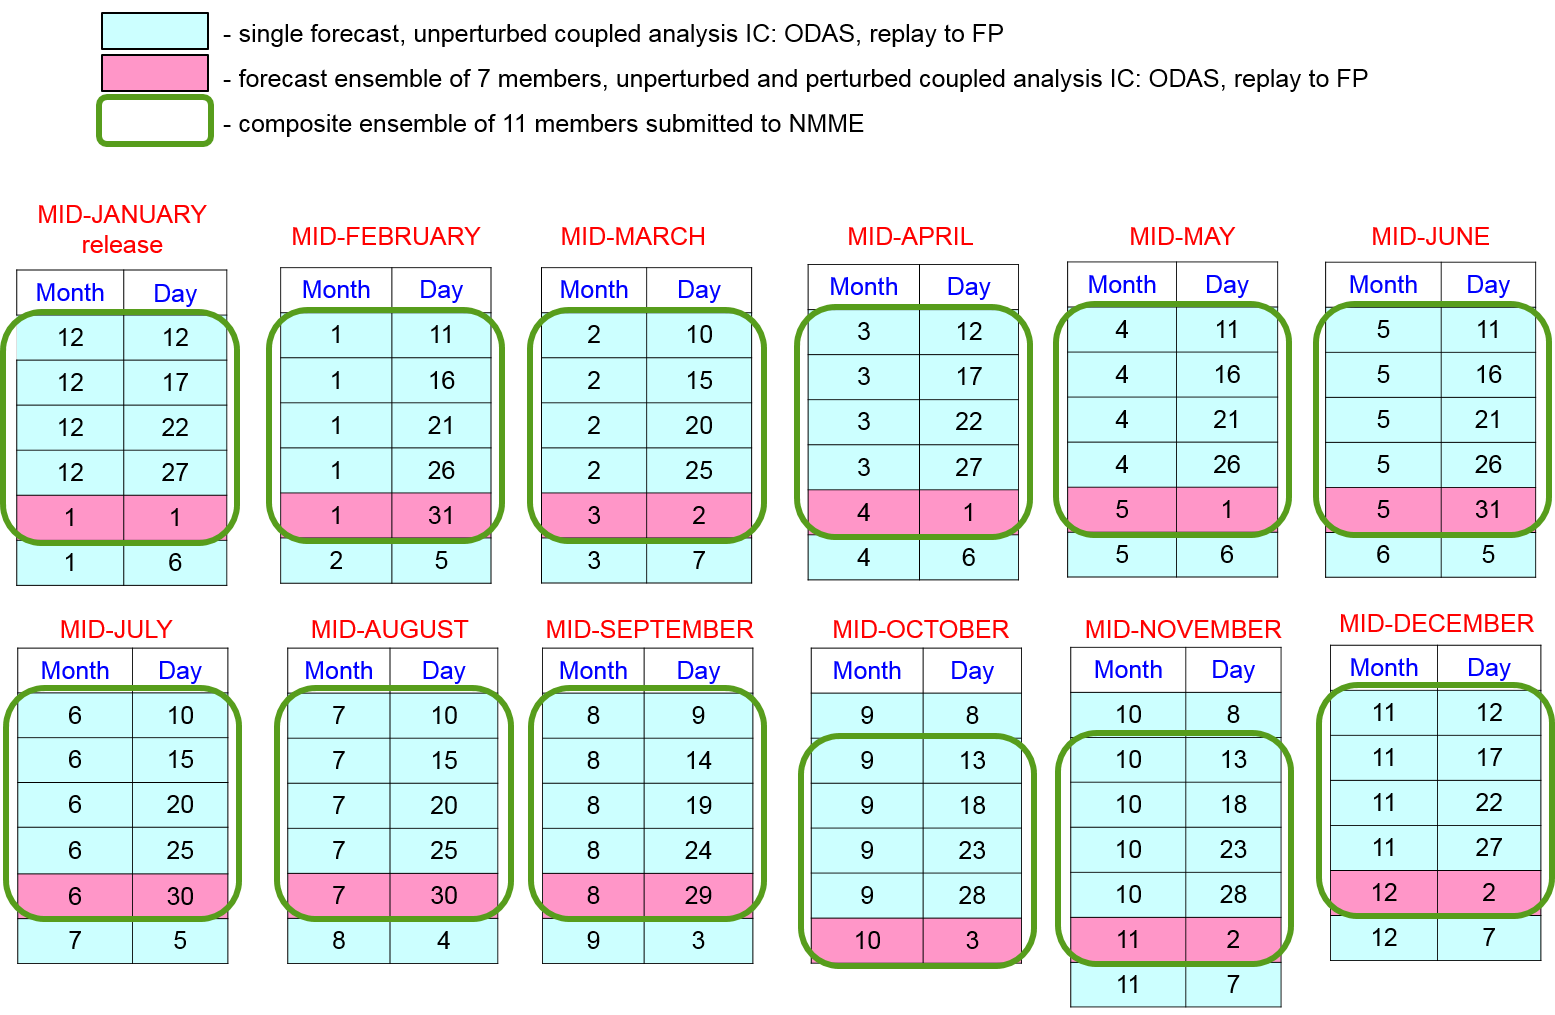
The following table shows the start dates for the various ensemble members of the GMAO S-I forecasts and hindcasts (following the schedule of NOAA/EMC predictions). The dates colored in pink denote the times closest to the start of the month for which additional ensemble members are generated using various perturbation methods.
|
 |